Overview
In cross-border payments, data is not just about reporting—it’s hidden profit. The global payment landscape is complex and diverse: user habits vary by country, payment methods span cards, local wallets, and BNPL; and bank rules, risk strategies, and network stability differ vastly. Unlike the highly unified domestic payment environment with high success rates, cross-border payments require deep analysis of “Why it failed,” not just “Whether it succeeded.”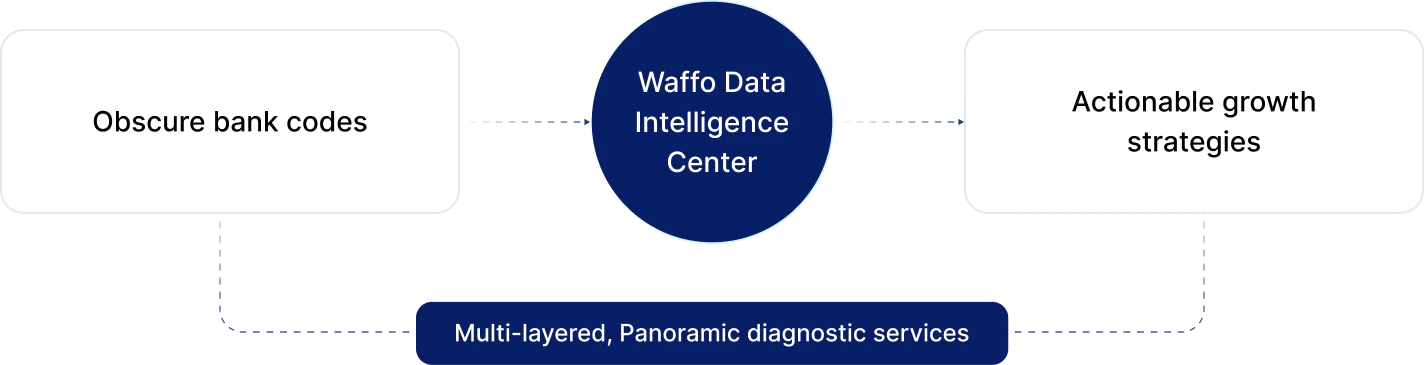
Monitoring & Omnichannel Funnel
Waffo monitors not just payment outcomes, but the entire user payment journey, especially for complex hybrid payment scenarios.Real-Time Health Dashboard
The Real-Time Health Dashboard provides immediate visibility into your payment performance: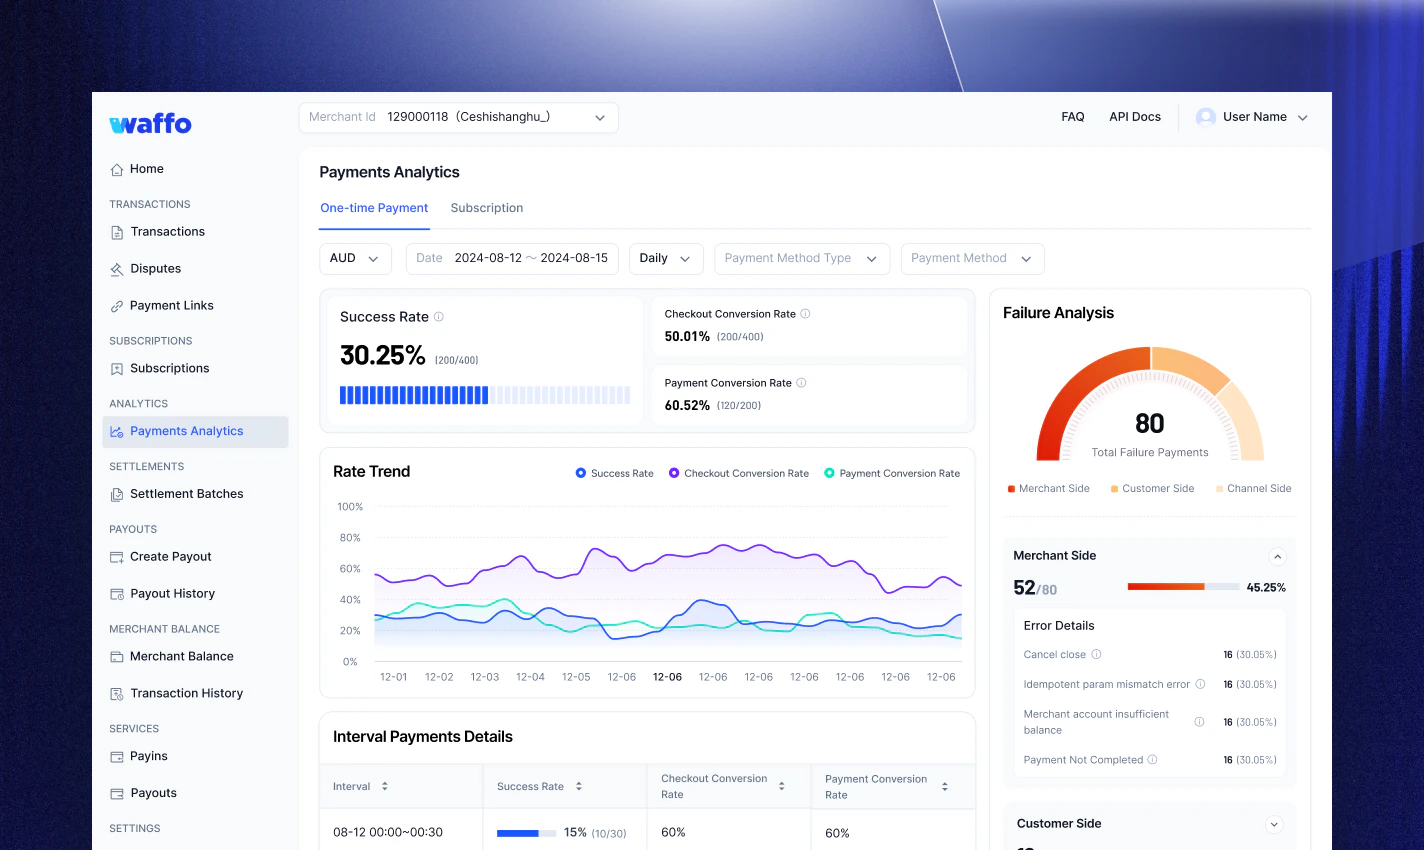
Omnichannel Conversion Funnel
Addressing the distinct payment logic between Bank Cards (Direct) and E-Wallets/BNPL (Redirect), we provide a unified funnel view:- End-to-End Monitoring: Tracks the complete journey from “Merchant Invokes Checkout”, each step has clear metrics, helping you reconstruct the real user path from entry and selection to operation and completion.

- Drop-off Diagnosis: Data clearly tells you whether user churn is due to failure to enter the checkout (technical issue) or abandonment during method selection/info entry (experience or intent issue), guiding targeted optimization of redirect links, payment lists, or interaction flows.

Drill-down & Smart Attribution
When success rates fall below expectations, Waffo provides powerful analysis tools to locate the “root cause.”Multi-Dimensional Drill-Down
- Geo & Issuer: Precise analysis down to specific Issuing Banks (BIN).
Scenario: Overall success rate is normal, but a specific “Brazilian Bank” has a 40% failure rate? This prompts you to optimize routing or installment strategies for that bank.
- Method Comparison: Horizontal comparison of Credit Card vs. Local Wallet performance. Data might show that pinning “Apple Pay” to the top in specific countries drives higher GMV.
Smart Code Mapping
Bank returns like “Do Not Honor” or “Error 05” are no longer black boxes. Waffo intelligently maps thousands of global raw decline codes into binary attribution categories, allowing your team to quickly decide on next steps, reducing ineffective troubleshooting and improving resolution efficiency.Subscription & Retention Health
For SaaS, Membership, and Recurring Billing merchants, we focus on reducing Churn and increasing LTV (Lifetime Value).Churn Attribution Analysis
Waffo clearly distinguishes between two distinct types of churn:Voluntary Churn: User manually cancels the subscription. (Requires product experience optimization)
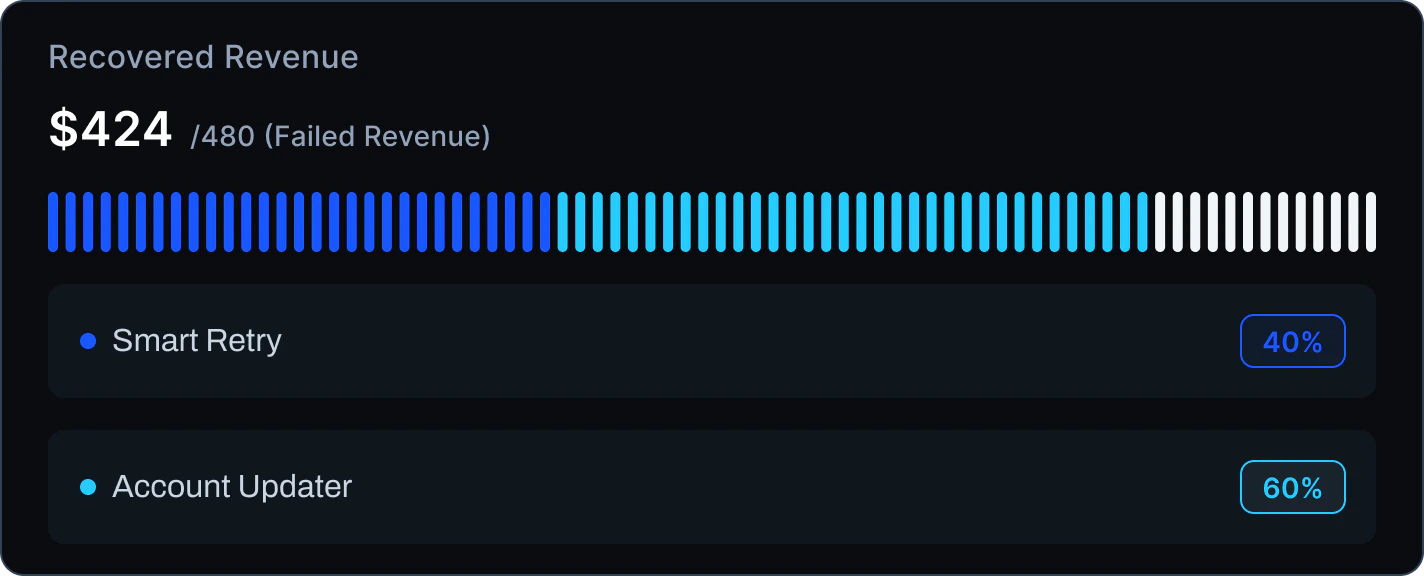
Recovery Performance Quantification
Recovered Revenue: Intuitively displays how much revenue—originally destined to fail—was automatically saved this month through Waffo’s Smart Retry and Account Updater mechanisms.

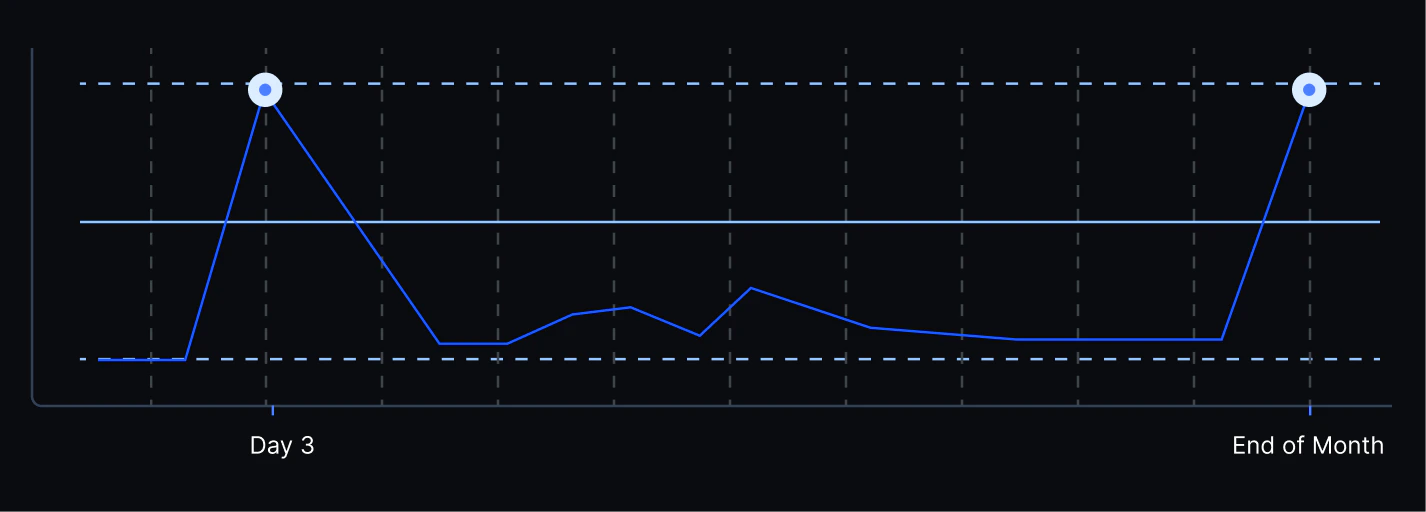
Cohort Analysis
Evaluate user lifecycle and channel quality from multiple dimensions:- First vs. Renewal Conversion: Distinguish between new user first-order conversion and existing user renewal conversion to locate bottlenecks at different stages.
- Retention Heatmap: Track the 3rd-month and 6th-month retention performance of users acquired in different months via different channels, helping marketing teams evaluate acquisition quality.
Frequently asked questions
What is "Auth Rate" and how does Waffo calculate it?
What is "Auth Rate" and how does Waffo calculate it?
The formula is: Successful Transactions / Total Attempted Transactions. Waffo’s advanced analytics supports excluding non-systemic factors like “User Input Errors” or “Voluntary Cancellations” to present a more referenceable Technical Success Rate.
How can data help me with "Do Not Honor" declines?
How can data help me with "Do Not Honor" declines?
This is the most common generic decline. Waffo data often reveals that enabling 3DS Authentication in specific high-risk scenarios can significantly reduce this error rate. Our system will suggest dynamic adjustments to risk strategies based on this, converting declines into successes.
Why is "Involuntary Churn" analysis important?
Why is "Involuntary Churn" analysis important?
Industry data shows that 20%-40% of subscription churn stems from payment failures rather than user intent. Solving this is the fastest, lowest-cost way to increase LTV.
Is your data real-time?
Is your data real-time?
The Real-Time Health Dashboard provides second-level updates, ideal for monitoring during big sales events. Deep Attribution and Cohort Analysis are typically updated on a T+1 basis to ensure data cleaning and reconciliation accuracy.
Need help? Contact support